Audio Excerpts
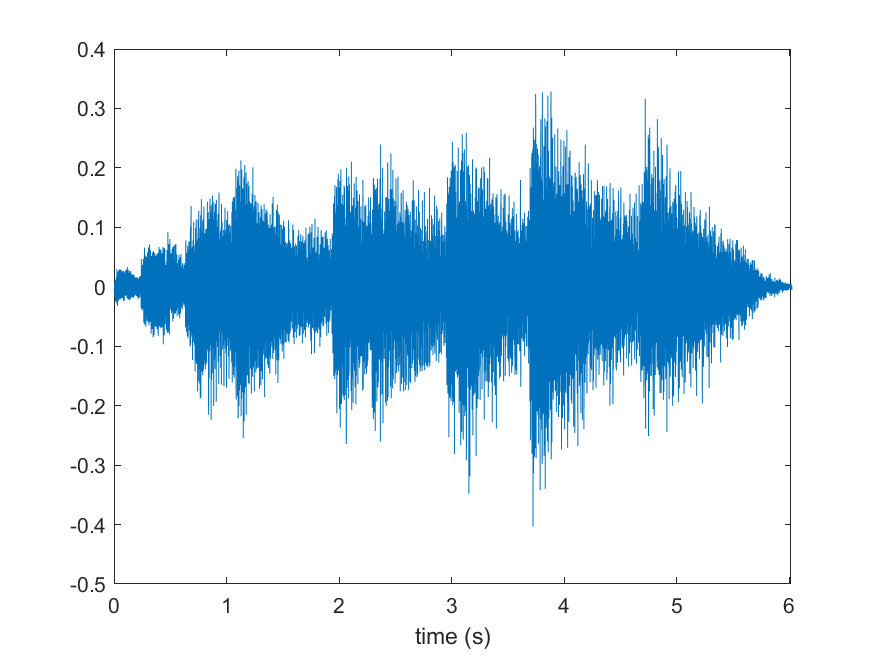
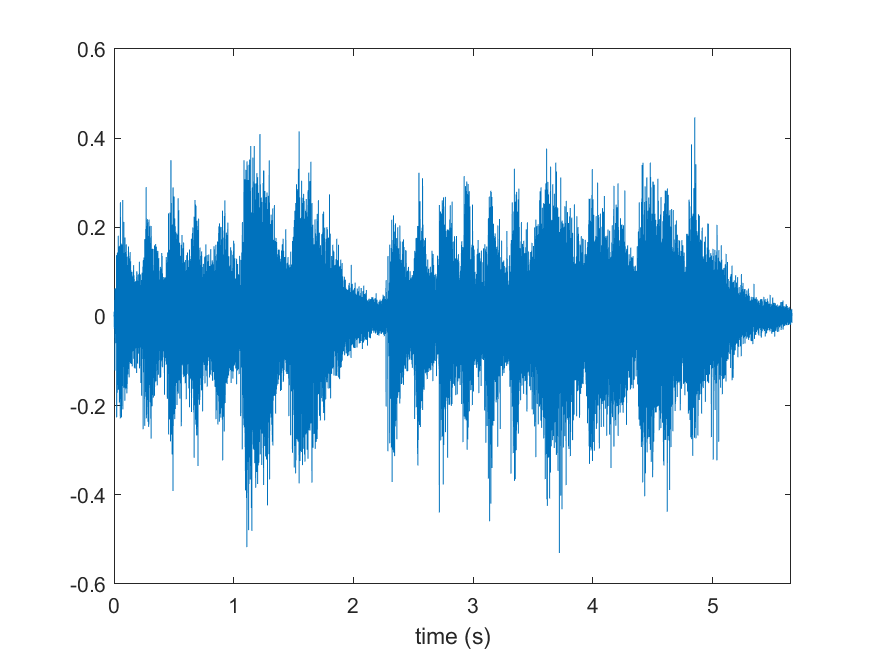
The audio database used for the evaluation consists of 10 musical excerpts in mono, sampled at 44.1 kHz, with an approximate length of 7 seconds. They were extracted from the EBU SQAM database. The excerpts were thoroughly selected to cover a wide range of audio signal characteristics. Since a significant number of methods is based on signal sparsity, the selection took care about including different levels of sparsity in the signals (w.r.t. the Gabor transform).
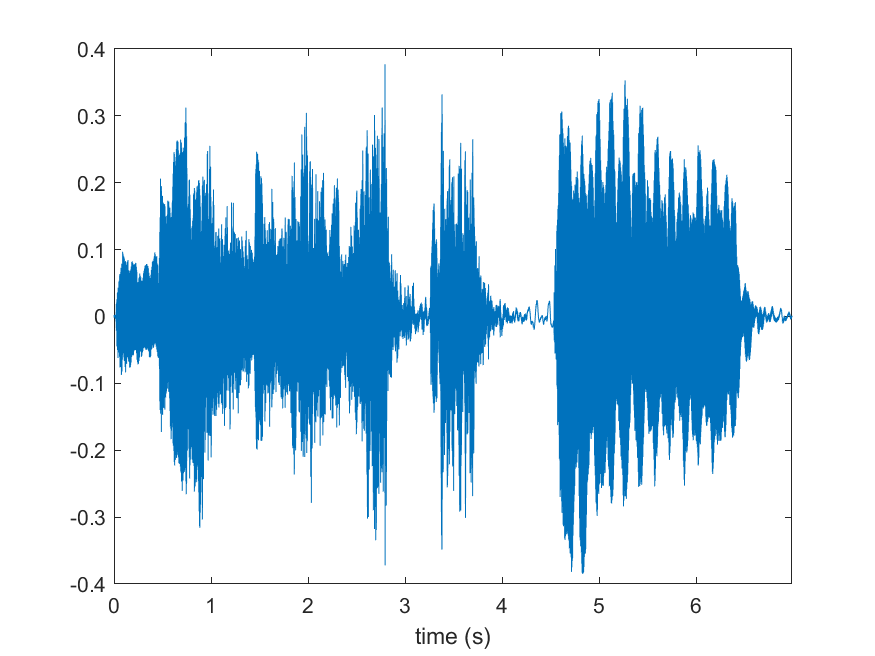
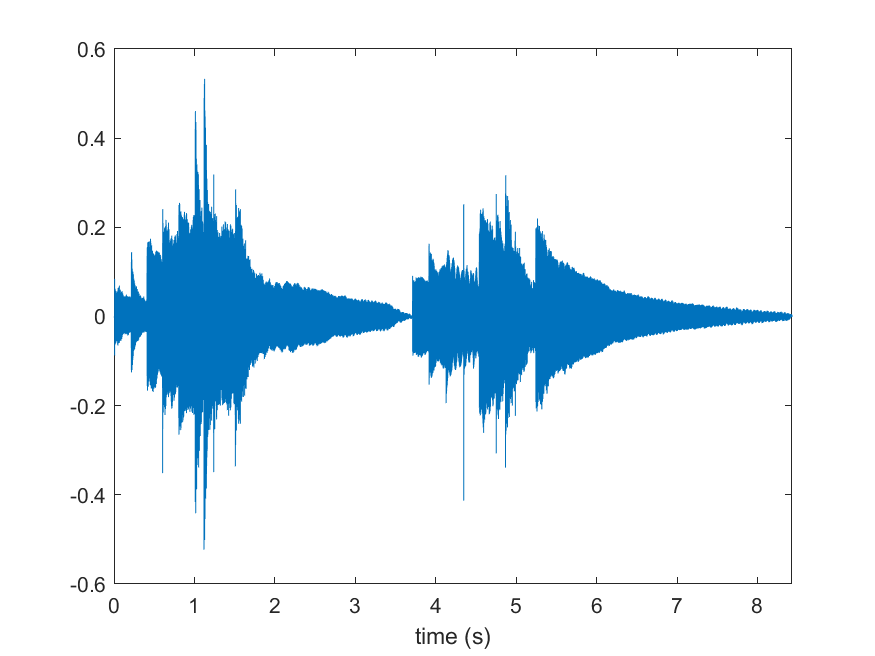
01. violin
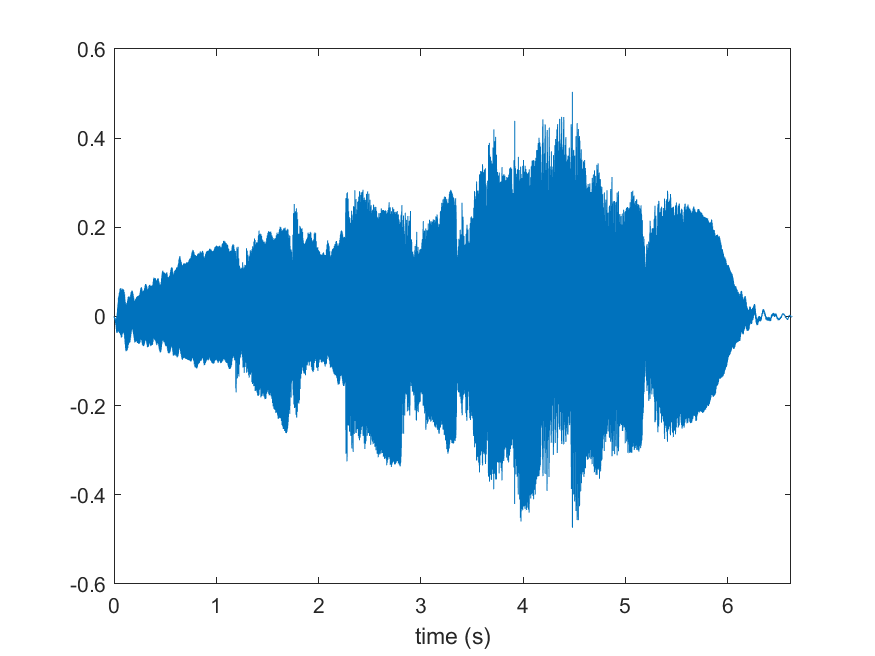
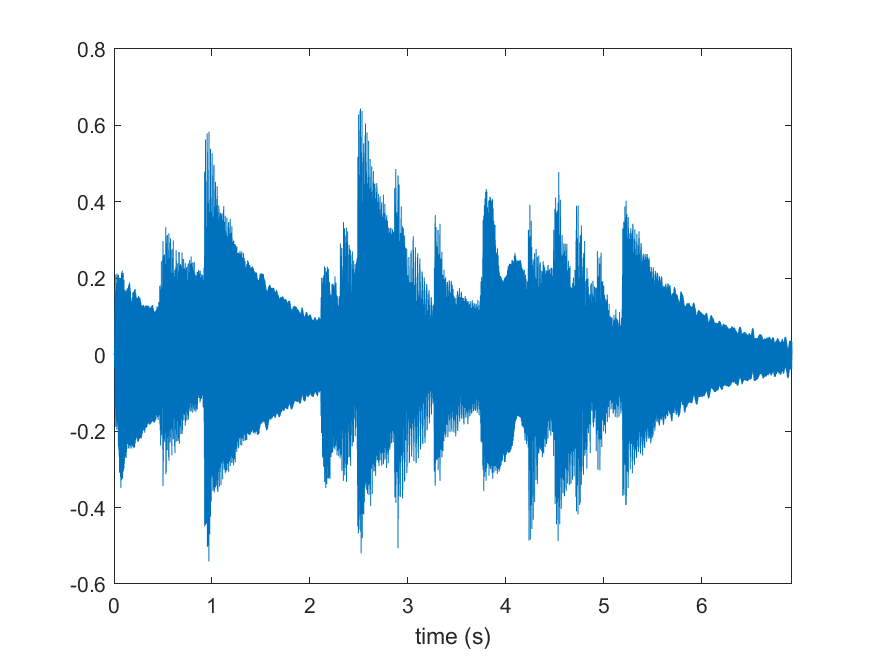
02. clarinet
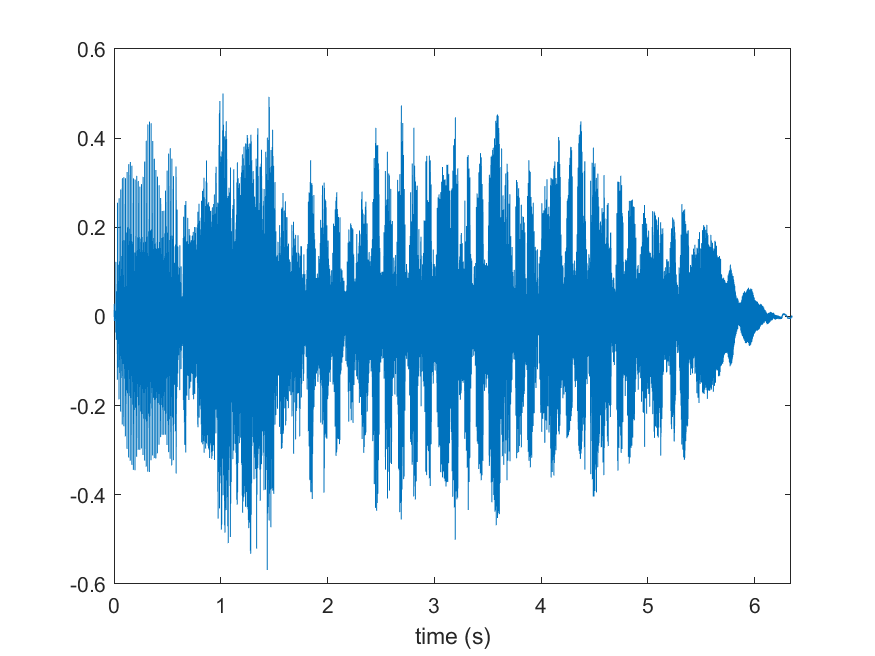
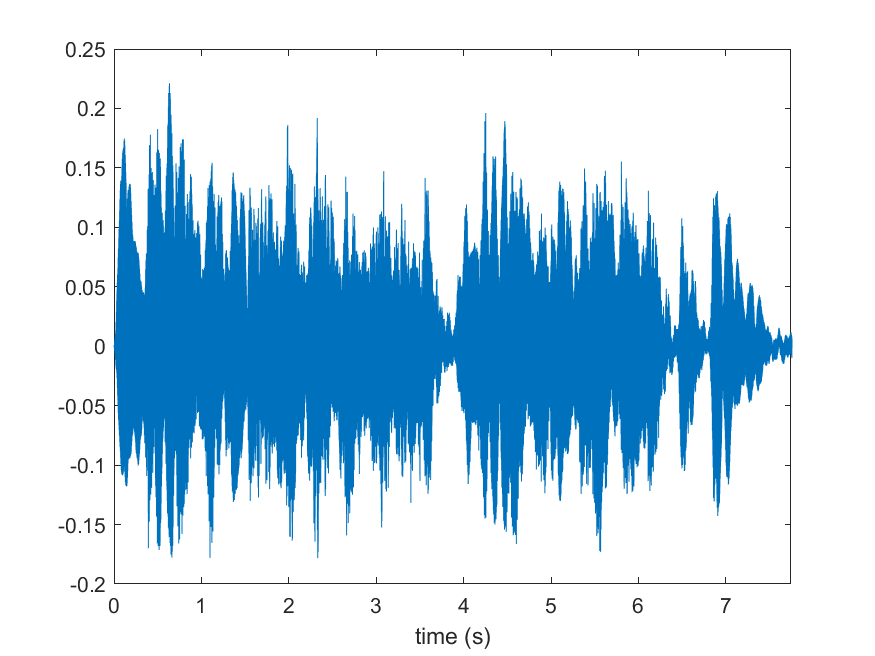
03. bassoon
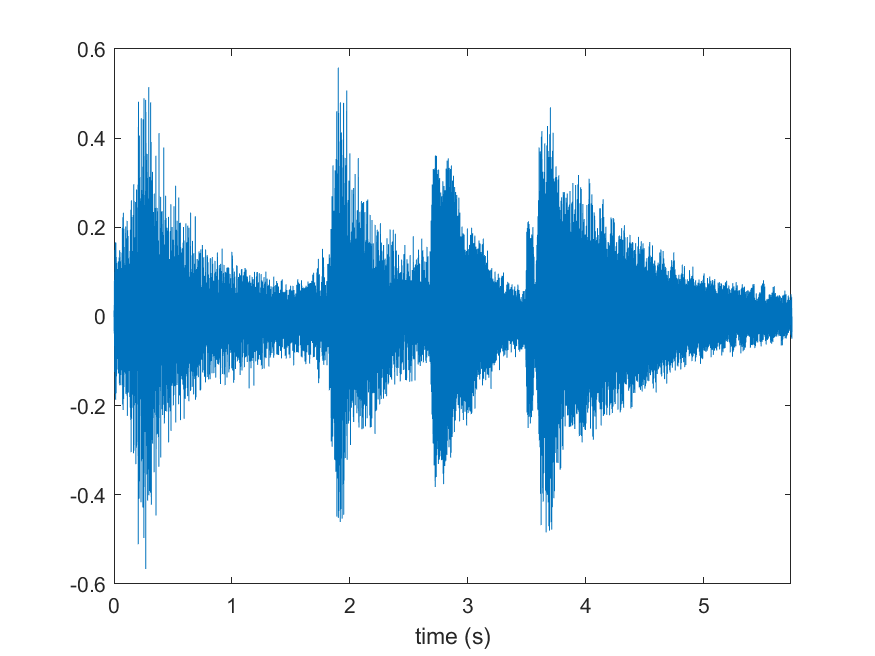
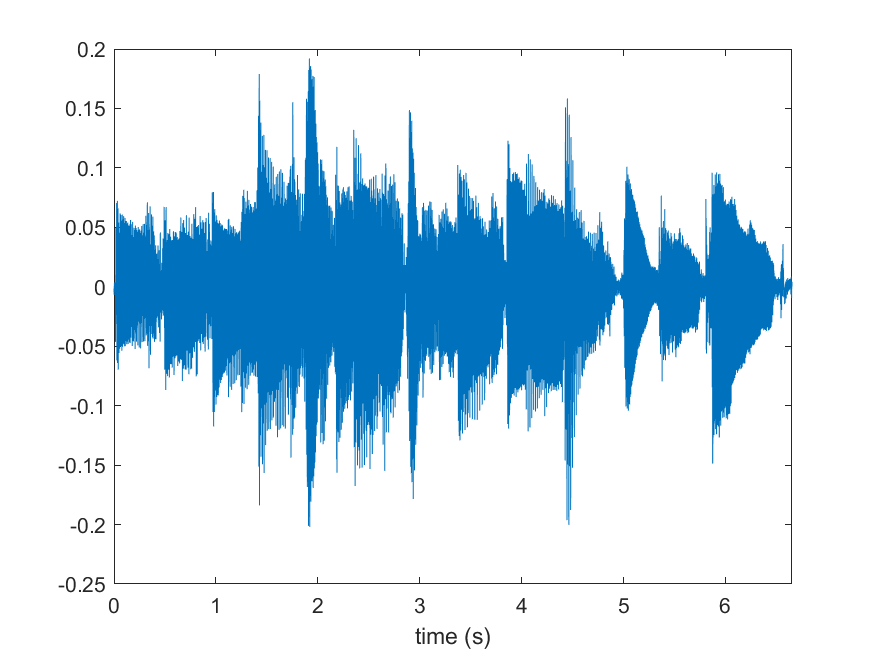
04. harp
05. glockenspiel
06. celesta
07. accordion
08. guitar
09. piano
10. wind ensemble
The table below contains listenable excerpts from all three articles. It is possible to select the initial level of degradation (input SDR) and the displayed evaluation metric. The postprocessing switch is relevant only for the algorithms inconsistent in the reliable part, which are marked with *. To listen to results related only to the Audio Declipping Survey, leave the option “Inconsistent restoration” switched on. The other two options relate to methods presented in the article Audio declipping performance enhancement via crossfading.
The playback can be started by clicking on one of the table cells (the cells turn light blue when the cursor hovers over them). Your browser must support HTML5 audio player. Alternativelly, the file path is shown below the player and it can be downloaded by Save Link As ...
Select input SDR:
1 dB
3 dB
5 dB
7 dB
10 dB
15 dB
20 dB
Select table values:
None
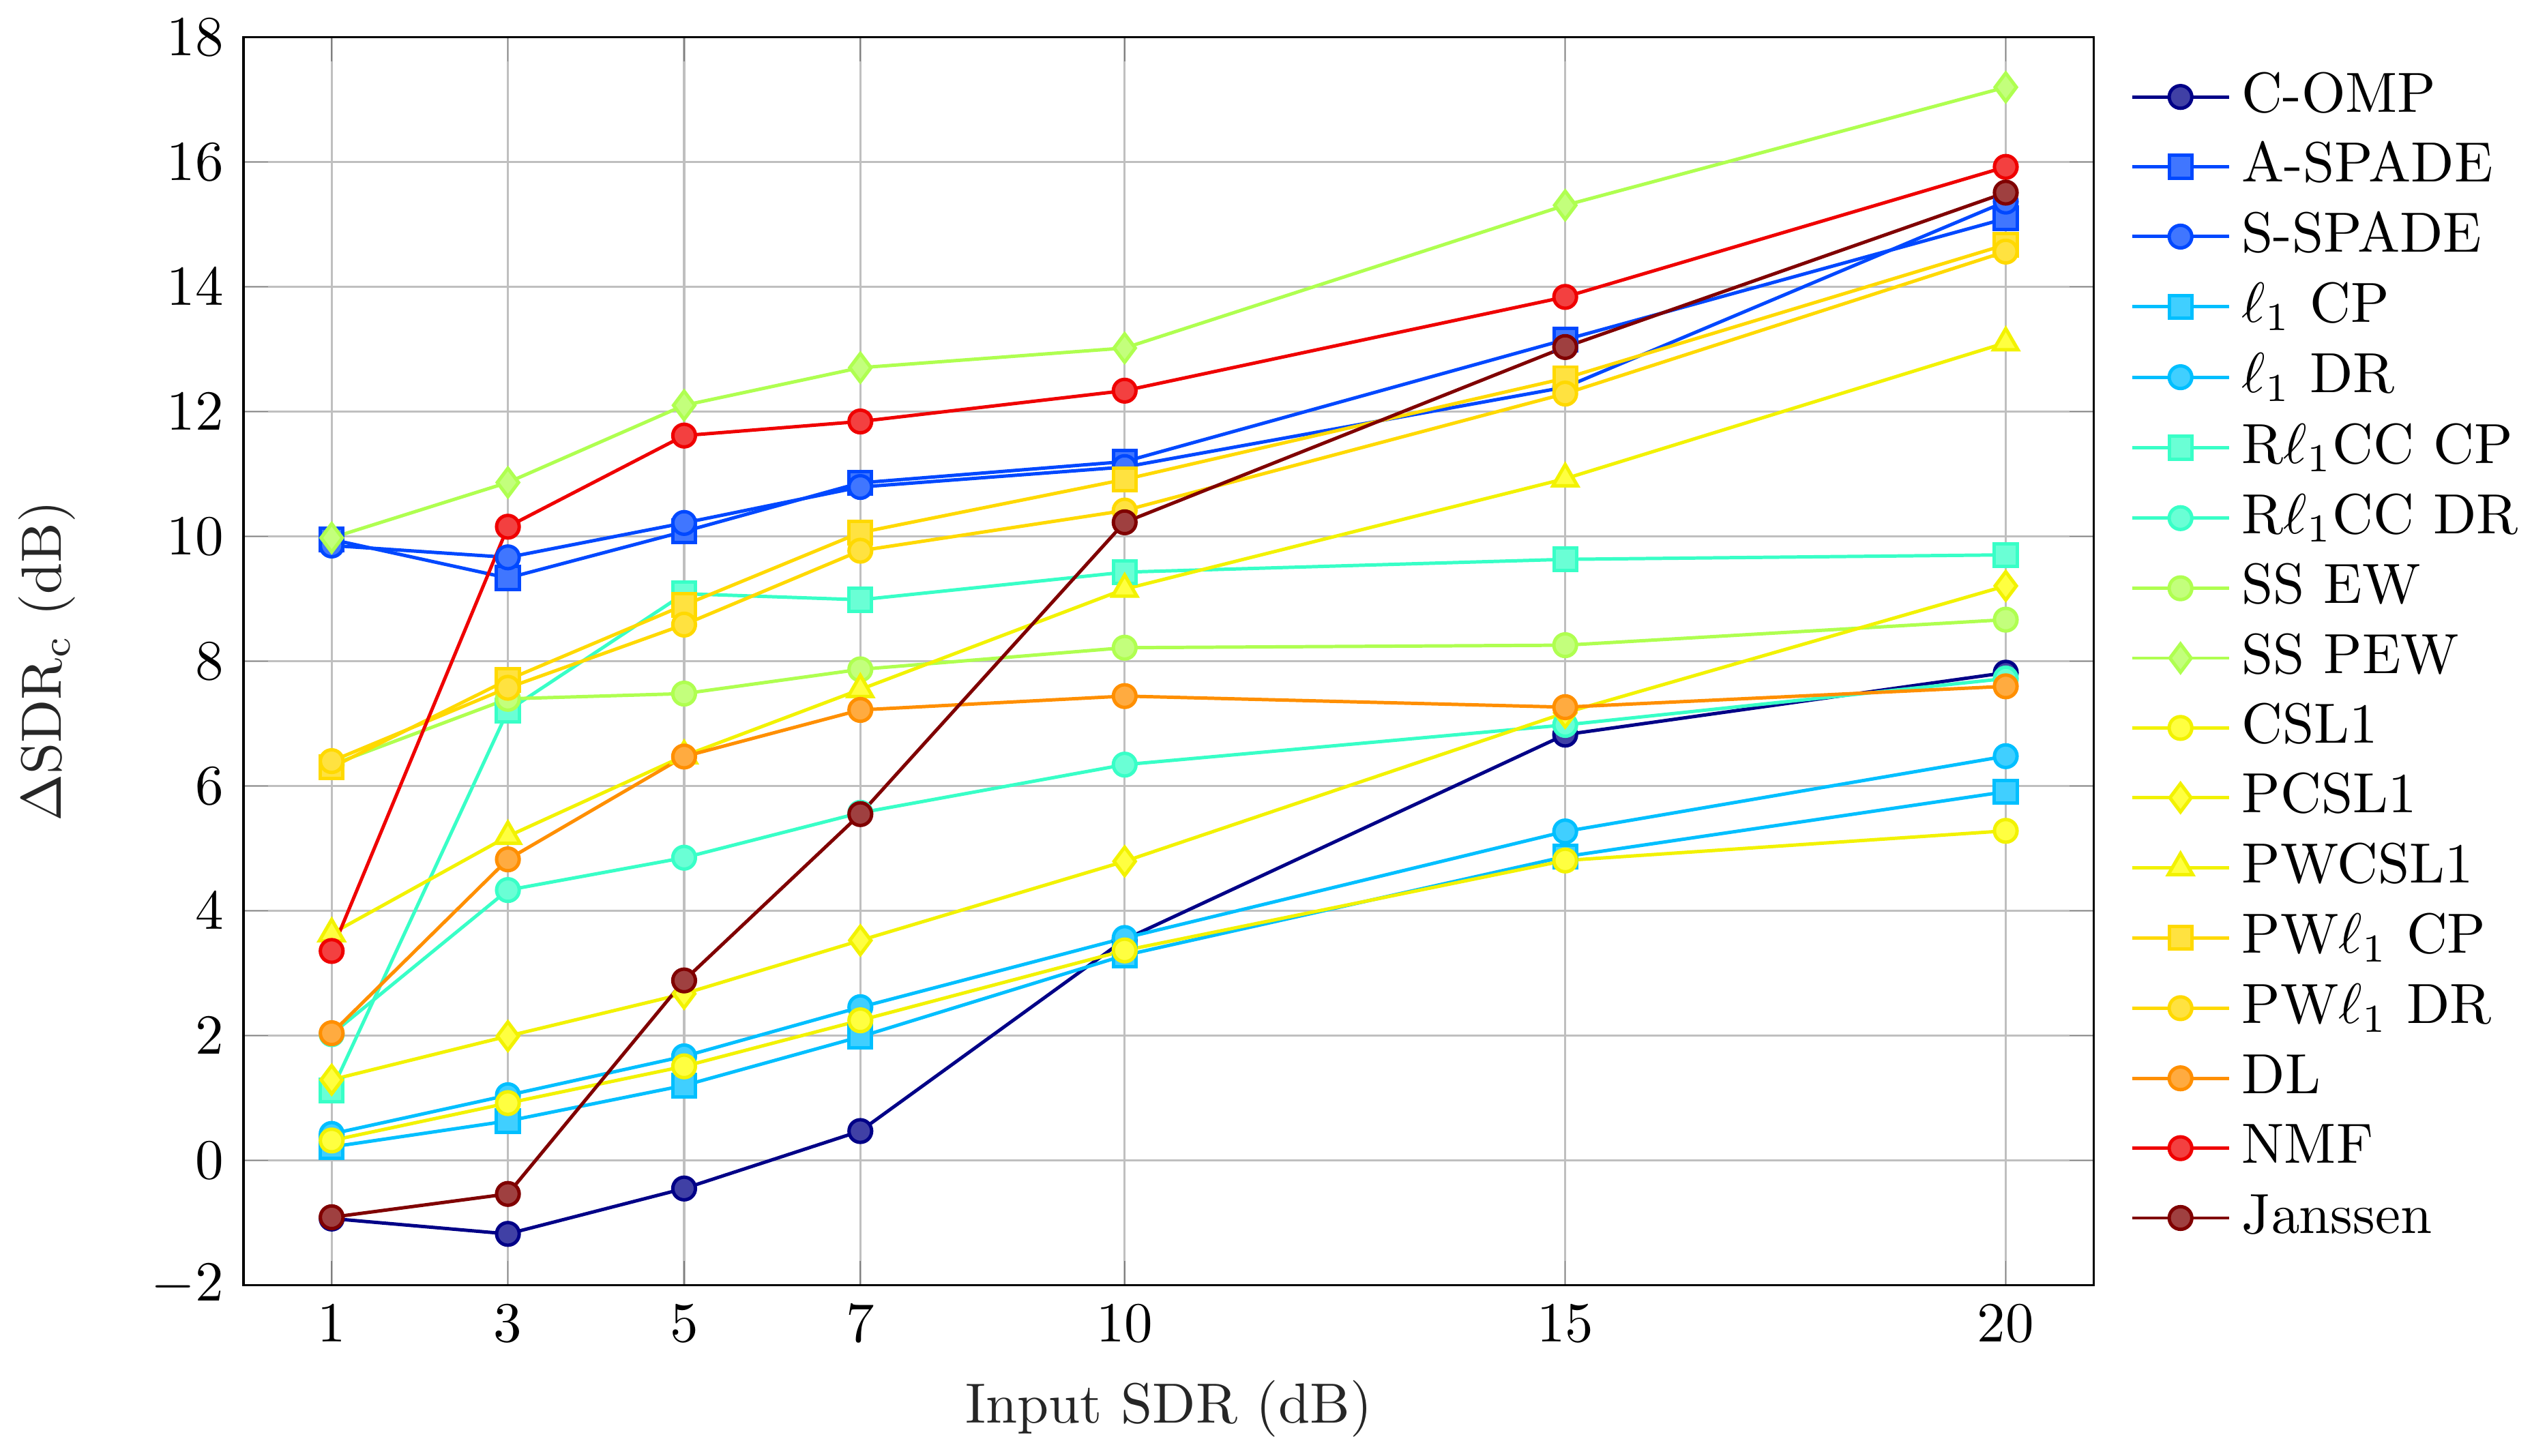
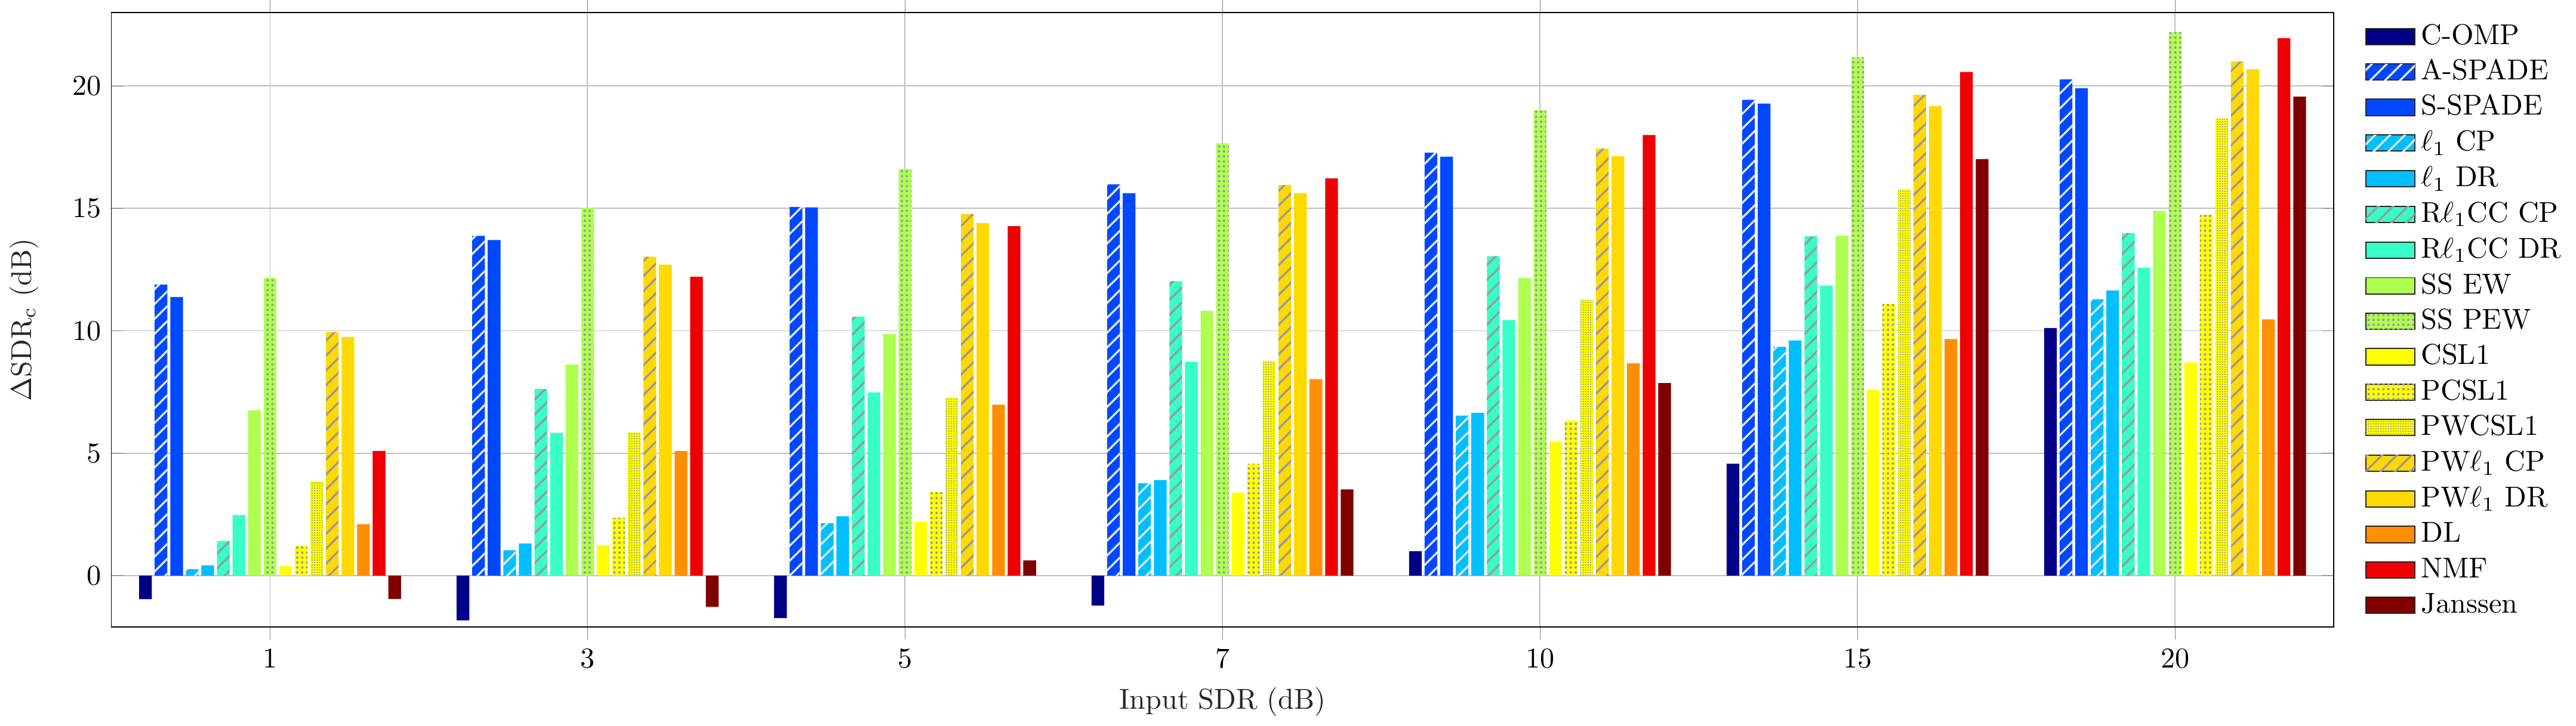
∆SDRc
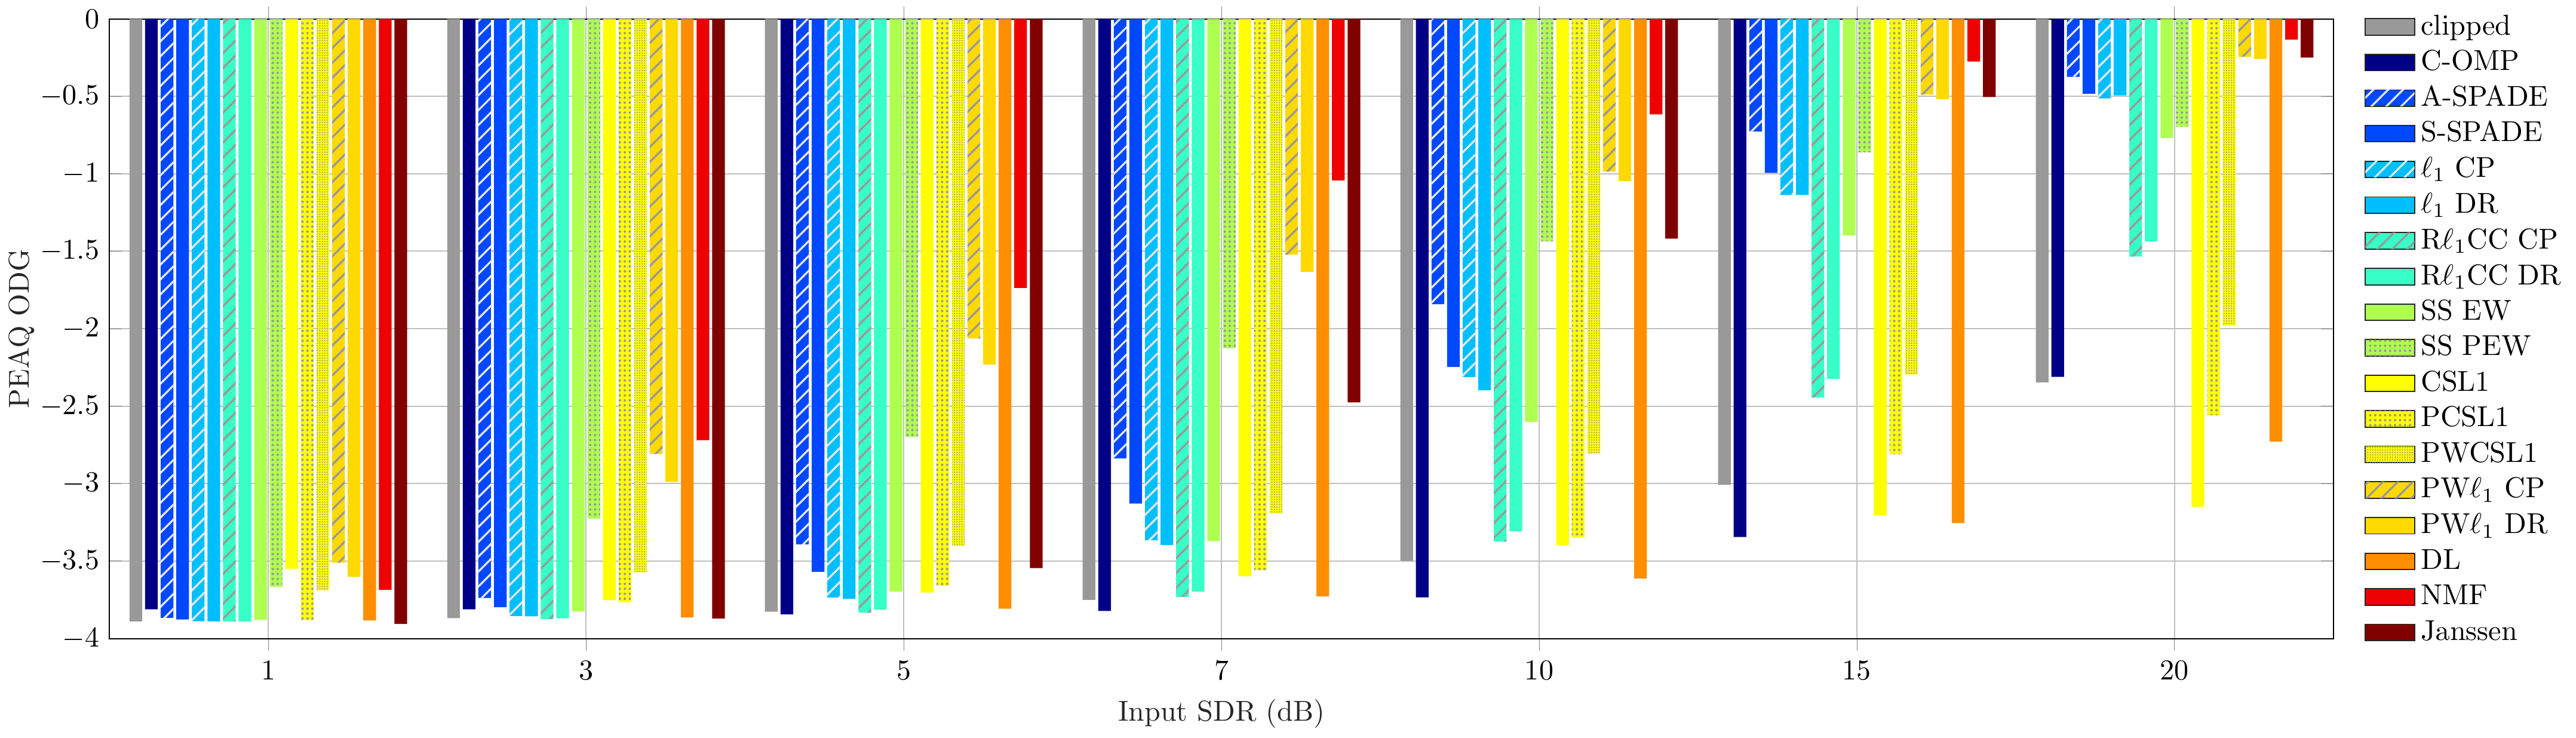
PEAQ ODG
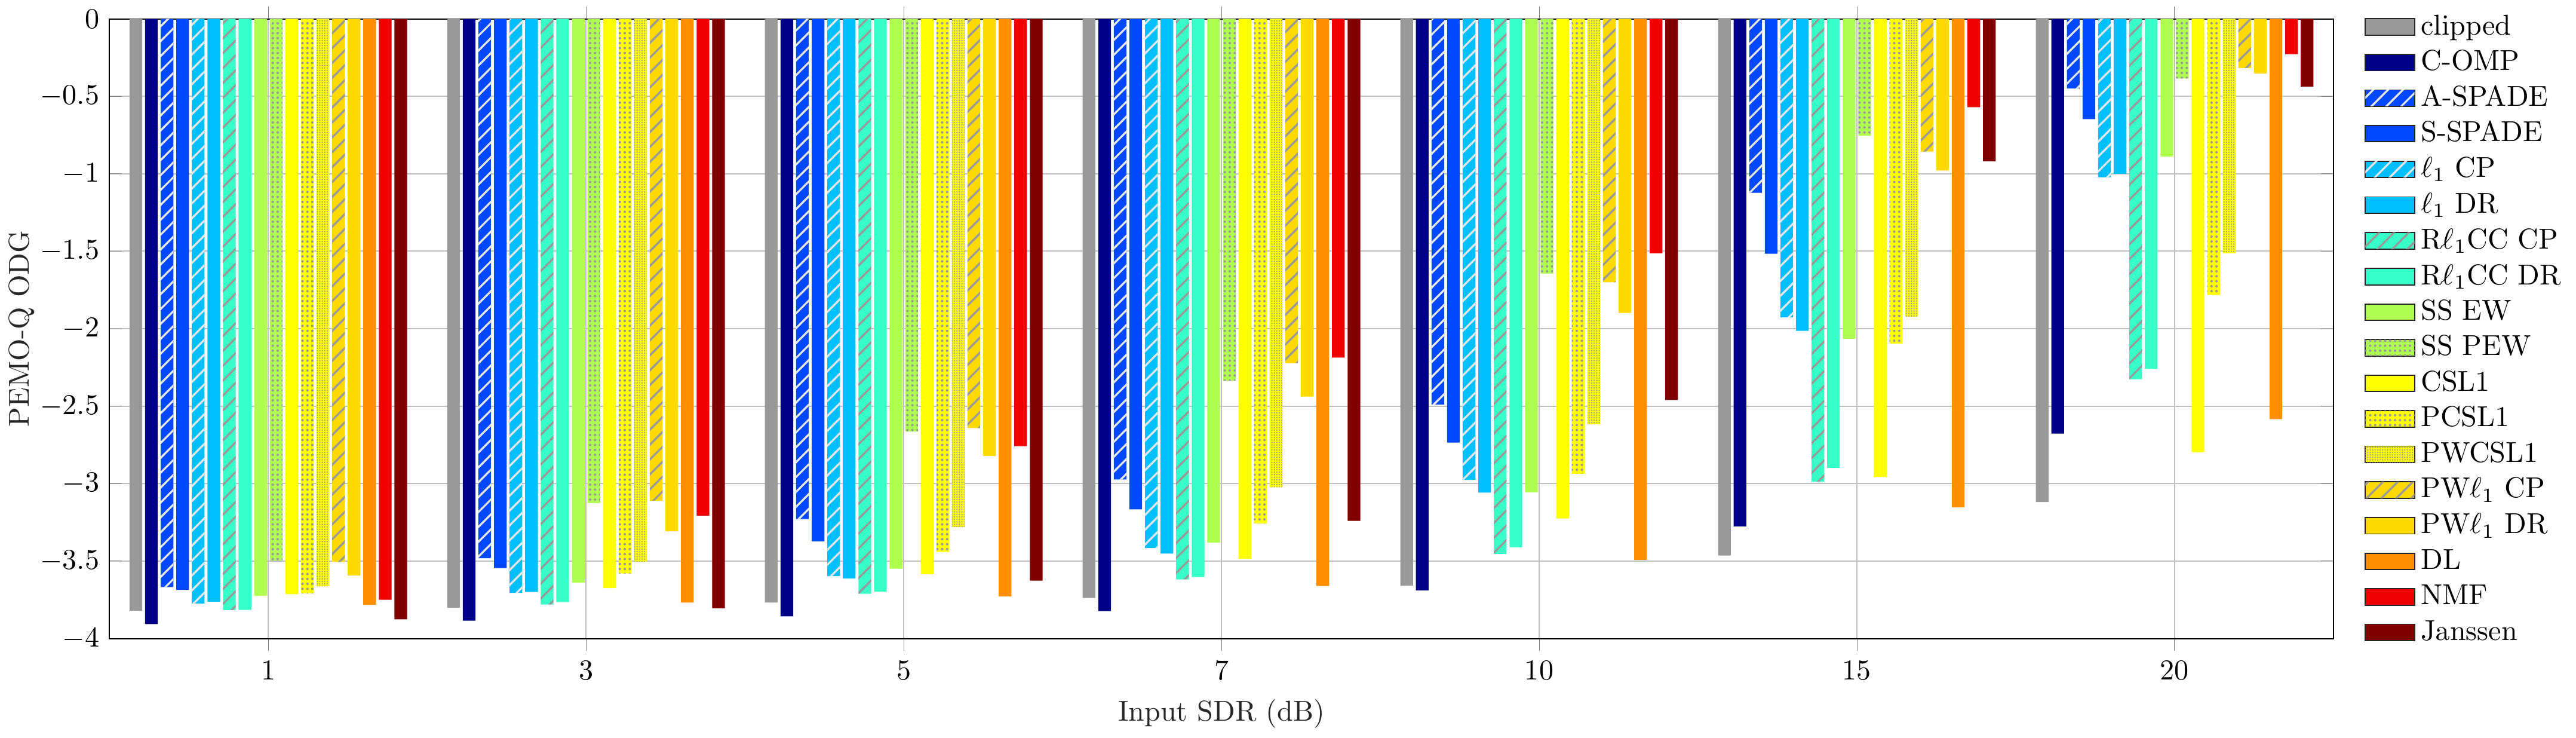
PEMO-Q ODG
Rnonlin
Select postprocessing of reliable samples:
Inconsistent restoration
Replace Reliable
Crossfaded Replace
Loaded file: None
| 01 | 02 | 03 | 04 | 05 | 06 | 07 | 08 | 09 | 10 | |
| Original | X | X | X | X | X | X | X | X | X | X |
| Clipped | X | X | X | X | X | X | X | X | X | X |
| C-OMP* | X | X | X | X | X | X | X | X | X | X |
| A-SPADE | X | X | X | X | X | X | X | X | X | X |
| S-SPADE | X | X | X | X | X | X | X | X | X | X |
| ℓ1 CP | X | X | X | X | X | X | X | X | X | X |
| ℓ1 DR | X | X | X | X | X | X | X | X | X | X |
| Rℓ1CC CP | X | X | X | X | X | X | X | X | X | X |
| Rℓ1CC DR | X | X | X | X | X | X | X | X | X | X |
| SS EW* | X | X | X | X | X | X | X | X | X | X |
| SS PEW* | X | X | X | X | X | X | X | X | X | X |
| CSL1* | X | X | X | X | X | X | X | X | X | X |
| PCSL1* | X | X | X | X | X | X | X | X | X | X |
| PWCSL1* | X | X | X | X | X | X | X | X | X | X |
| PWℓ1 CP | X | X | X | X | X | X | X | X | X | X |
| PWℓ1 DR | X | X | X | X | X | X | X | X | X | X |
| DL* | X | X | X | X | X | X | X | X | X | X |
| NMF | X | X | X | X | X | X | X | X | X | X |
| Janssen | X | X | X | X | X | X | X | X | X | X |
| ASS EW* | X | X | X | X | X | X | X | X | X | X |
| ASS PEW* | X | X | X | X | X | X | X | X | X | X |